Chrome – the most popular browser on the Internet is also the favorite tool for frontend and backend engineers alike. The plethora of options dev tools offer, encompasses not just HTML, Javascript debugging, it keeps getting rich in features.
The network panel in dev-tools is the most powerful pane to exist in terms of understanding the slowest component of your website.

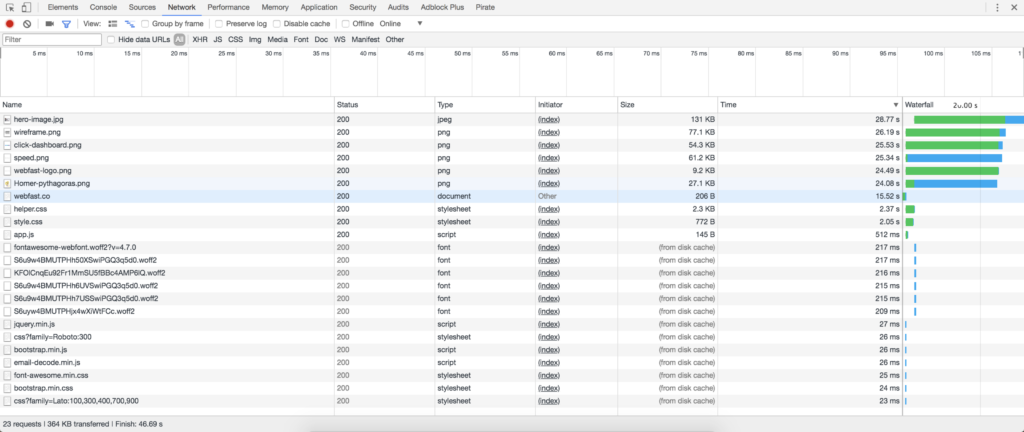
Using the network panel is intuitive, as always, open any URL, https://webfast.co, right click and select Inspect.
Click on the Network tab and you will see a lot of options. The section with Status code is most critical for our current task.

Click on “Time” row to sort it by descending order. Here’s the fun part, you now see the response that takes longest to load. Before we jump to conclusions, it’s important to understand the Waterfall column.
Waterfall shows how browser is queuing up the requests to download various assets for the HTML page.
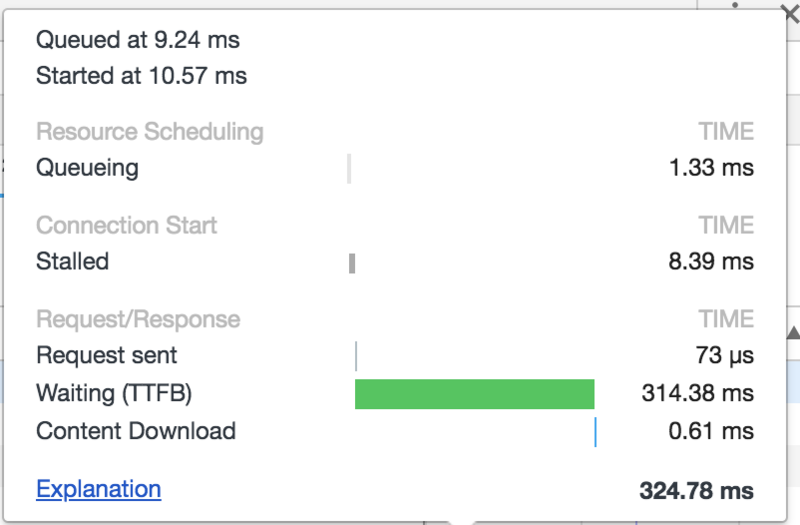
There are few key terminologies associated with Waterfall that are important to understand. Hover your mouse over the horizontal bar graph and you will see the following geek-o-logy.

- Queued at 1.40 sec: Emphasizing the current request is serially dependent on some other request. Think about this as a “blocking” request from a page fully loaded perspective.
- Stalled: Implies the request is stalled, mainly attributed to the webpage making too many requests.
- Request sent: The time it took the browser to send the request. Usually this is in milliseconds range.
- Waiting (TTFB): TTFB also known as Time To First Byte is crucial as it indicates the time it took the server to respond back to the request.
- Content download: The time it took to download the actual content from the server to the browser.
With 30% of total browser requests being serial, saving 10ms per requests can reduce page load times by 10% aka 270ms.

When you are optimizing your website, every stage matters. A typical page makes ~80 requests, and optimizing few ms at every stage adds up!
Do you have a website that is extremely slow for mobile web?

